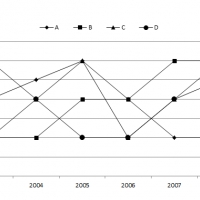
Line Diagram 20
Study the following graph carefully to answer the given questions Number of Products purchased by 3 companies X,Y and Z Q1. The number of products purchased by Company Y increased in 2003 by what % of the number of products purchased by Company X in 2001 ? 1. 75% […]