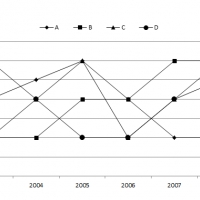
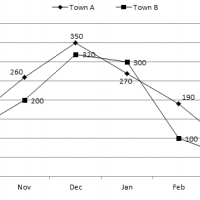
Data Interpretation

Line Diagram 17

Study the following graphs and answer the following questions:  Number of students in different branches in 5 colleges Q1. What is the difference between the average number of civil engineers and electrical engineers? 1. 65              2. 70              3. 75              4. 82              5. None of these Q2. In college R, number of mechanical engineers is what

Line Diagram 17 Read More »

Line Diagram 16

Study the following graph to answer the given questions: – Percent profit earned by two companies over the given years. % profit = [(income –expenditure)/(expenditure)]*100 Q1. If the expenditure of company P in 2000 was Rs. 200 crores, what was its income? 1. 200            2. 220            3. 260            4. 280         5. None of these Q2.

Line Diagram 16 Read More »