Directions (Q.1 – 5): Study the graph carefully to answer the questions that follow.
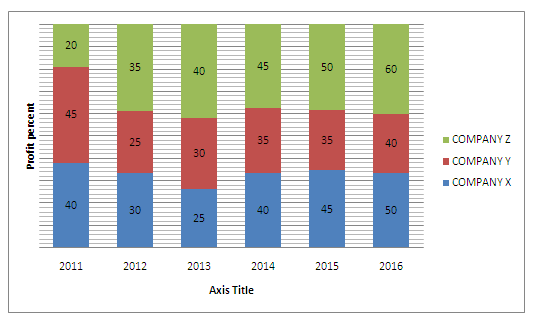
Q1. If profit for company Y in 2012 is 2000 and expenditure in 2013 for company Y is 50,000, then what is the total revenue in 2013 for Y? Give that total revenue = expenditure + profit.
(a) 52600
(b) 54200
(c) 53280
(d) 55800
(e) None of these
Q2. If profit in year 2015 for company Z is 3000 and profit of company X in 2013 is equal to profit of company Z in 2014 then what is the profit of company X in 2013
(a) 1500
(b) 4000
(c) 3500
(d) 2000
(e) 2500
Q3. What is the average percentage increase in profit for company Y over all the years.
(a) 49%
(b) 32%
(c) 23%
(d) 38%
(e) 35%
Q4. What was the approximate percent increase in percent increase of profit of company X in the year 2014 from its previous year
(a) 60%
(b) 65%
(c) 55%
(d) 50%
(e) 70%
Q5. If profit earned by company Y in 2014 is 27,000 and by company Z in 2014 is 43500 then what is the total profit earned by them in year 2013?
(a) 25,000
(b) 35,000
(c) 40,000
(d) 50,000
(e) None of these
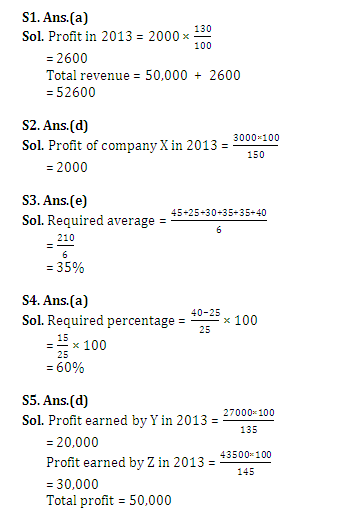
Answer & Explanation