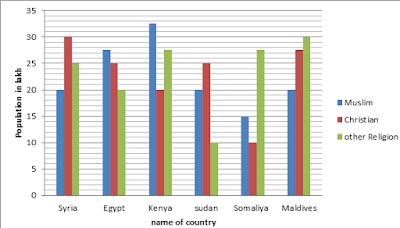
Study the bar graph and pie-chart carefully and answer the following questions.The bar graph shows the number of people of different religions in six different countries
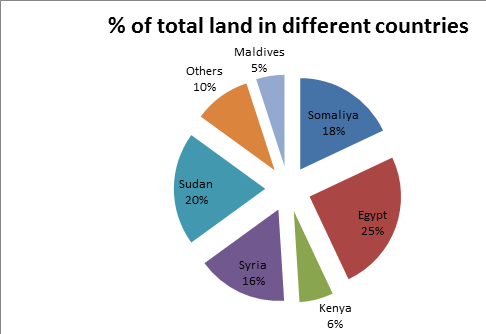
The pie-chart show the percentage of the total land in different countries& total land = 50 lakh square kilometres
Q1 .In the given countries the population of which religion is the maximum?
1) Muslim
2) Other religions
3) Christian
4) Either Christian or Muslim
5) Both Muslim and Other religions
Q2 .Which country has the minimum population density?
1) Syria
2) Egypt
3) Somalia
4) Sudan
5) Maldives
Q3 .The population of Muslims in Kenya is what per cent of the population of Christians in Somalia?
1) 325%
2) 225%
3) 125%
4) 25%
5) 12.5%
Q4 .Which country has the maximum population?
1) Kenya and Sudan
2) Maldives
3) Sudan
4) Somalia
5) Kenya
Q5 .The annual rate of decrease in the population of Muslims, Christians and Other religions is 20%, 50% and 50% respectively. What was the population of Maldives two years ago?
1) 79.23 lakh
2) 121.25 lakh
3) 271.25 lakh
4) 242.2 lakh
5) none of these
Answer & Explanation 1.2 2. 4 3. 1 4. 5 5. 5