Study the graph and answer the following questions. Data related to the number of plants planted by 2 villages X and Y.
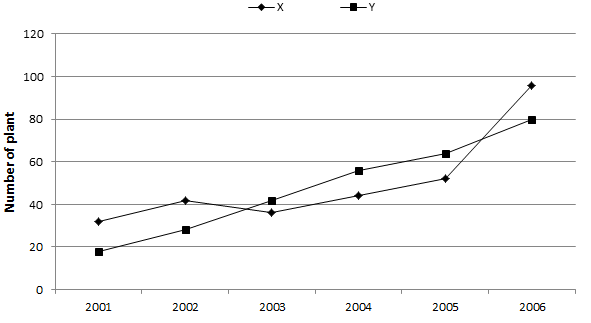
2001 2002 2003 2004 2005 2006
32 42 36 44 52 96 X
18 28 42 56 64 80 Y
Q1. Number of plants planted by village X increased by what percentage from 2001 to 2005 ?
1. 62.24% 2. 62.5% 3. 65.2% 4. 54.5%
Q2. What is the average number of plants planted by village Y during 2001,2003,2005 and 2006 ?
1. 48 2. 50 3. 51 4. 54
Q3. What was the total number of plants planted by village Y in 2002 and 2006 ?
1. 102 2. 104 3. 106 4. 108
Q4. Find the ratio of total number of plants planted by X in 2001 and 2002 to the total number of plants planted by Y in 2003 and 2004 ?
1. 13:19 2. 37:49 3. 25:43 4. 7:9
Q5. Which village plant more number of plants in 2003 and what is the difference between number of plants planted by both villages in 2003 ?
1. Y,6 2. X,6 3. X,7 4. Y,5
1. 2
2. 3
3. 4
4. 2
5.1