
Study the following charts and answer the following questions:
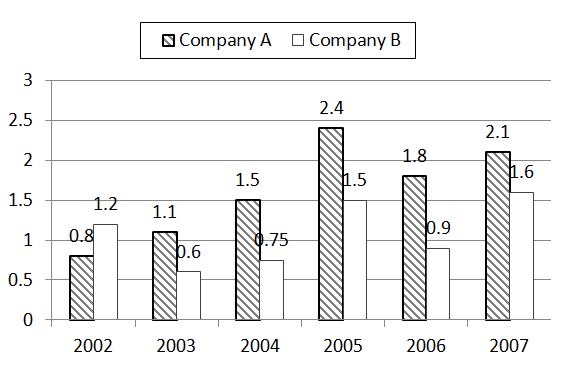
The following bar graph shows the ratio of the export to import of two companies A and B over the period 2002-07.
Q1. In how many years is the import is more than the export of company A?
1. None 2. one 3. two 4. three 5. More than three
Q2. If the total number of import of company A for the years 2005 and 2006 was Rs 50 crore, what was the total export for the same years?
1. 25 2. 30 3. 34 4. can’t be determined 5. None of these
Q3. In which of the following years, the difference between the export and import of company A is minimum.
1. 2002 2. 2004 3. 2005 4. can’t be determined 5. None of these
Q4. If the difference the import and export for company B for the year 2004 was Rs. 50 crore. Find the value of export for the same year?
1. 100 crore 2. 120 crore 3. 150 crore 4. 180 crore 5. None of these
Q5. Had the export for company A in 2005 is decreased by 25% and import is increased by 25% for the same year, what would be the new ratio of export to import?
1. 1.22 2. 1.46 3. 1.44 4. 1.52 5. None of these
1. 2
2. 4
3. 4
4. 3
5. 3