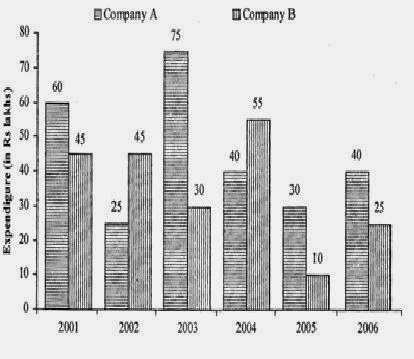
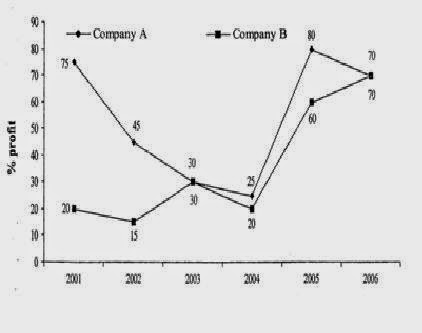
Directions (1-5): The expenditure and percentage profit of two companies A and B for six years in the period 2001-2006 are shown in the given bar graph and line graph. The expenditure is given in lakhs.
Q1. What is the difference between the average expenditure of Company A from 2001 to 2006 and that of Company B?
1) Rs 60 lakhs
2) Rs 45 lakhs
3) Rs 30 lakhs
4) Rs 15 lakhs
5) Rs 10 lakhs
Q2. In how many of the given years is the income of Company A more than Rs 100 lakhs?
1) Four
2) Three
3) Two
4) One
5) None
Q3. In how many years is the profit of Company B more than Rs 10 lakhs?
1) Five
2) Four
3) Three
4) Two
5) One
Q4. In 2004, the income of Company B is what percentage more than the income of Company A?
1) 32%
2) 24%
3) 16%
4) 12%
5) 8%
Q5. What is the ratio of the income of Company B in 2004 to that of Company A in 2005?
1) 9 : 13
2) 13 : 9
3) 11 : 9
4) 13 : 11
5) 5 : 4
[expand title=”Answer & Explanation”]
1.(5) Total expenditure of A = 270
Average expenditure = 270 / 6 = 45
Total expenditure of B = 210
Average expenditure = 210 / 6 = 35
Difference = 45 – 35 = 10
2. (4) In 2001, profit = (60 x 75) / 100 = 45
Income = 60 + 45 = 105 lakhs
3. (4) In 2006 = (25×170) / 100 = 42.5 lakh
Profit = 42.5 – 25 lakh = Rs 17.5 lakhs
In 2004 Profit is 18 lakh
4. (1) In 2004 and 2006
In 2004, income of A = 50 lakhs
In 2004, income of B = 66 lakhs
Req percentage = (66 – 50) / 50 X 100 = 32%
5. (3) In 2004, income of B = 66 lakhs
In 2005, income of A = 54 lakhs
Req Ratio: 66 : 54 = 11 : 9
[/expand]