
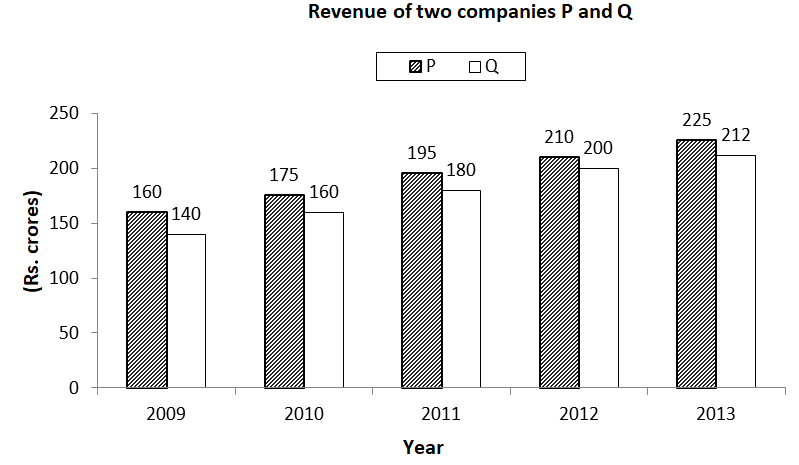
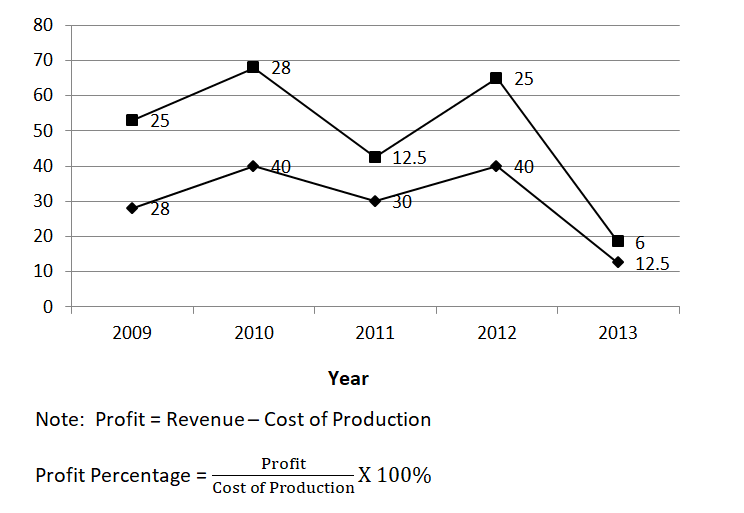
Q1. What is the profit obtained by the two companies P and Q together in 2013?
1. Rs.33 cr 2. Rs.37 cr 3. Rs.41 cr 4. Rs.45 cr 5. None of these
Q2. In 2010, what was the ratio of profit of the company P to the profit of the company Q?
1. 10 : 7 2. 13 : 10 3. 16 : 13 4. 19 : 16 5.None of these
Q3. What is the approximate percentage increase in the total profit of companies P and Q together from 2010 to 2012?
1. 8.45% 2. 13.35% 3. 17.65% 4. 20.25% 5. 24.15%
Q4. In which of the given years was the total profit of both the companies together the highest?
1. 2009 2. 2010 3. 2011 4. 2012 5. 201
Q5. In how many of the given years was the profit of the company P more than the profit of the company Q by at least Rs.15 crore?
1. 1 2. 2 3. 3 4. 4 5. 5
[expand title=”Answers”]
1. 2
2. 1
3. 3
4. 4
5. 3
[/expand]